Product Tour
Request a demo for more detailsTake a quick tour with Ed, the property managing panda!
See how Ed saves money and makes his life easier by using Comply to track and benchmark his entire portfolio of properties.
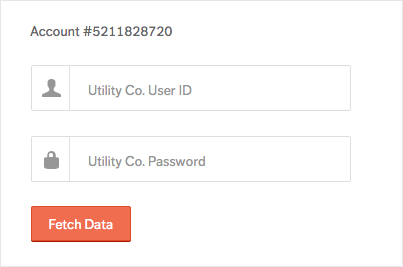
Automatically Manage Your Utility Data
Managing and collecting utility data across a portfolio of buildings is an expensive problem. Comply saves you time, money and toil. With no hardware or data entry required, Comply automatically imports data from hundreds of utility companies across North America. All that's required is a one-time setup with your username and password and Comply will do the rest.
We think you should be spending your time making your buildings more efficient, not typing data into spreadsheets.
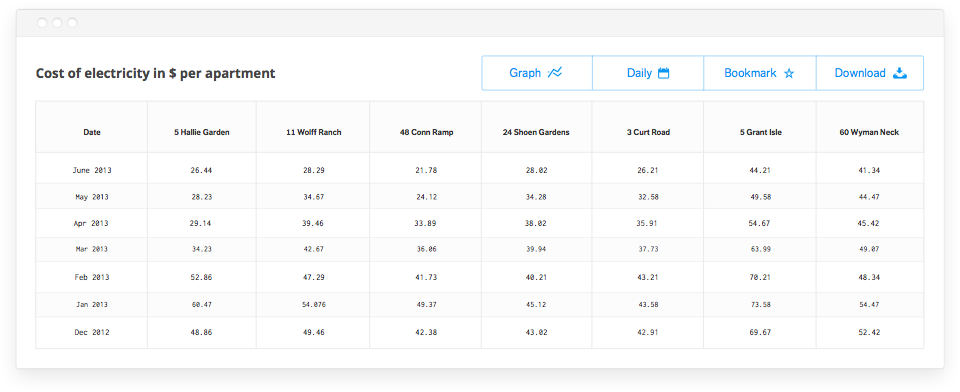
Download Your Raw Data
Utility data in Comply belongs to you, and it’s as easy to get data out of Comply as it is to get it in. It’s simple to download your energy and water data for reporting and independent analysis.
Normalized to Calendar Months
Comply normalizes your data to calendar months and rolls up meter data to the building and property level. For example, if you need the cost of electricity per apartment for the last year across all buildings, you can get that with a few clicks.
Track your Energy Usage
Following the one-time setup, your utility data will automatically flow into the Comply platform each month for ongoing tracking and analysis. You can compare utility usage across buildings, developments, regions, retrofit categories, and other customized groupings. You can also compare across tenant units within a given building.
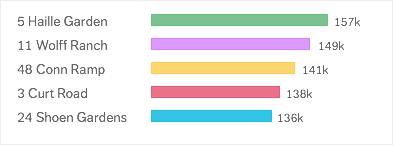

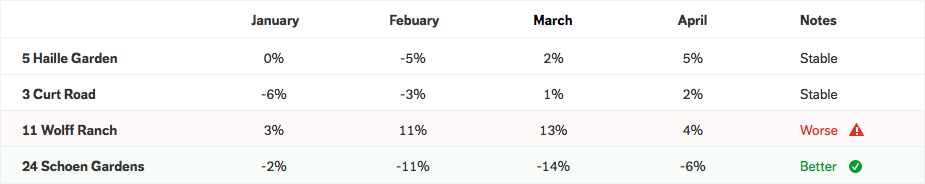
Benchmark
Benchmarking energy and water usage provides the foundation for improving the efficiency of your buildings. Armed with an understanding of how your buildings perform compared to similar buildings, you can prioritize action using data instead of hunches.
Benchmarking takes the guessing out of efficiency investment.
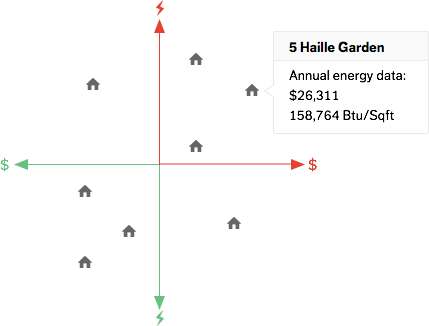
1 Within Your Portfolio
A comparison within your portfolio, highlighting the relative efficiency and cost of the buildings you oversee.
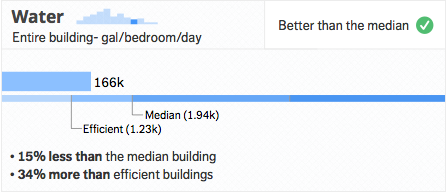
2 Peer Group Comparison
Our industry-leading database of real-world energy and water data to show how you stack up to your peers.
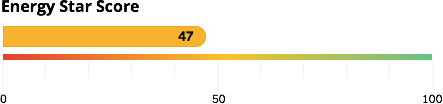
3 Energy Star
Need to get an Energy Star Score or comply with an energy benchmarking or disclosure ordinance or law? We've got that covered. Comply integrates seamlessly with EPA's Portfolio Manager.
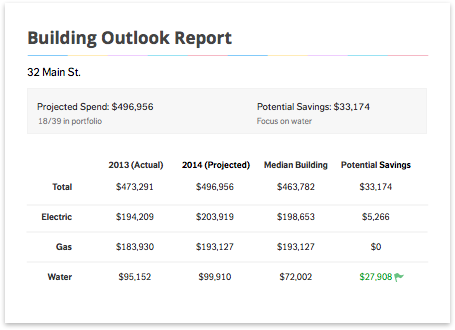
Identify Savings Potential
Are you interested in reducing your utility costs but in the dark on where to begin? Comply helps you quantify the savings potential of each of your buildings. In addition to assessing savings potential these reports help you forecast your utility budget.
Identify Spikes in Usage
Planning and budgeting requires predictable utility costs. Leaky toilets, equipment failure and utility bill errors can cause sudden spikes in costs. Comply helps you identify and address issues before they get out of hand.

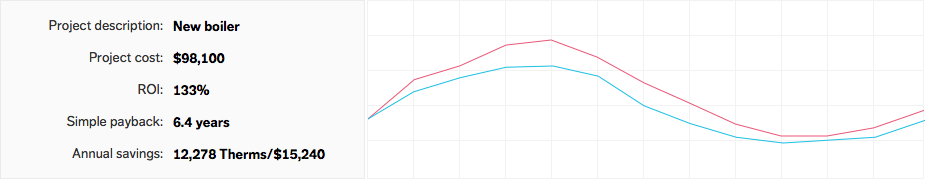
Measure and Verify Savings
You invest in building upgrades and retrofits, but how do you measure the results? How do you communicate those results to stakeholders? And how do you determine which efficiency investments are worth replicating in other properties? Our tools help you accomplish all of this. Our premium reports follow IPMVP Option C Measurement & Verification protocol.
Comply makes measurement and verification easy with crystal clear graphs and reports.
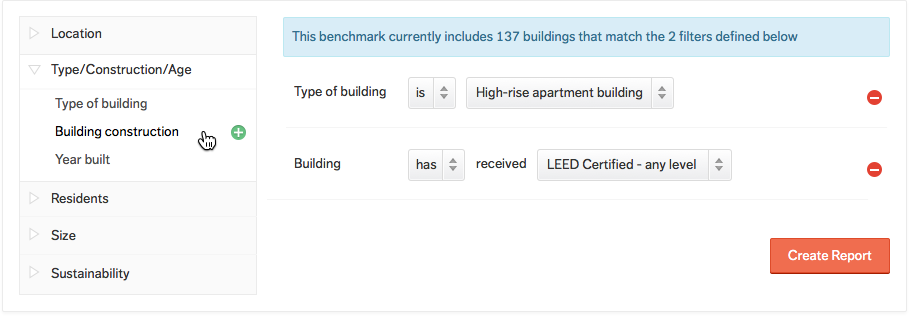
Custom Analysis and Reporting
Want to compare your new LEED-certified high-rise to other LEED high-rise buildings built in the last five years within the same city, adjusted for square footage?
Comply helps you perform this kind of refined analysis with the click of a mouse.
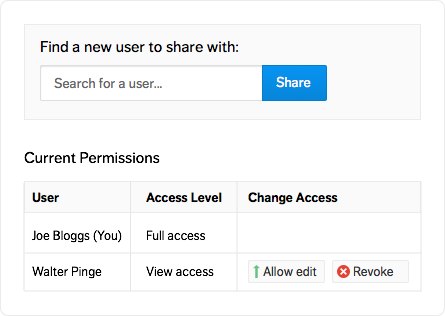
Share Data with Others
Comply lets you share your data with other Comply users in an instant. You can choose to give view or edit level access to a specific building or to an entire development at a time. You are in control of the entire process, so you know your information is secure.
A few ways users are connecting on Comply:
Building Owners
Superintendents
Efficiency Programs
Funding Recipients
Energy Auditors
Audit Customers
Finance Agencies
Loan Applicants